


MACD Indicator: Your Friendly Guide to Smarter Trading
Have you ever wondered how traders seem to spot the right time to buy or sell in the market? It’s almost like they have a secret weapon. Well, one of those powerful tools is the MACD indicator. Sounds fancy, right? But don’t worry — this guide will break it down into simple terms and help you understand how this nifty indicator can boost your trading game.
Discover the MACD indicator, MACD crossover, and algorithmic trading strategies for smarter market moves.
What is the MACD Indicator?
The MACD indicator is a popular technical tool used by traders to understand the momentum and direction of a stock or asset’s price. Imagine it as a speedometer for price movements — it tells you how fast prices are moving and in which direction.
MACD Full Form Explained
MACD stands for Moving Average Convergence Divergence. Don’t let it intimidate you; it’s just a way of measuring the difference between two moving averages of prices to find trading signals.
How Does the MACD Work?
At its core, the MACD subtracts a slower moving average from a faster moving average to see how these averages converge or diverge over time. Think of two runners on a track — if one pulls ahead or falls behind, the difference between them changes, signaling a potential change in momentum.
Key Components of MACD
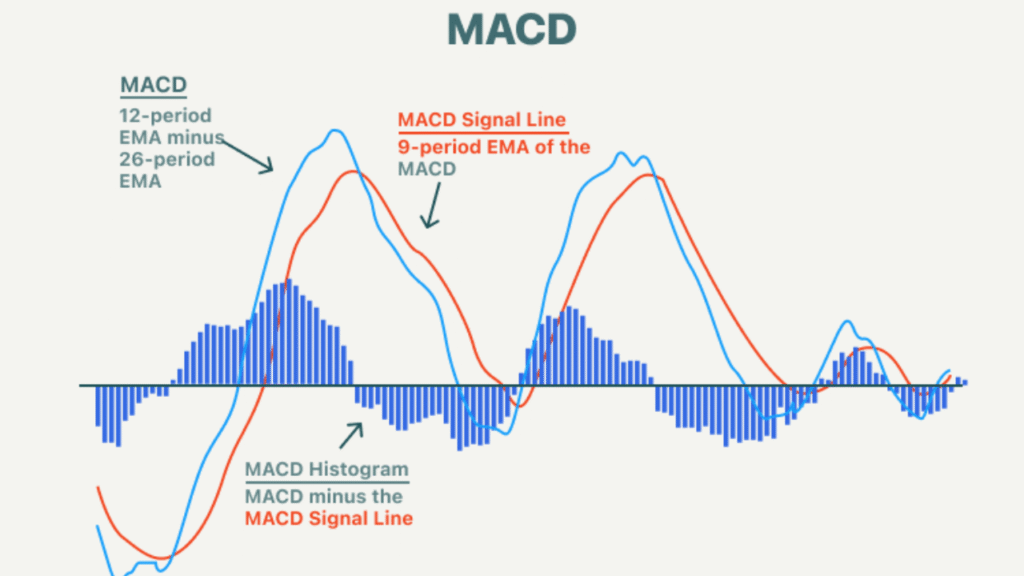
There are three main parts:
- MACD Line: Difference between the 12-day and 26-day exponential moving averages (EMAs).
- Signal Line: A 9-day EMA of the MACD Line — think of it as a smoother version to catch trends.
- Histogram: Shows the difference between MACD Line and Signal Line, helping visualize momentum.
Understanding the MACD Crossover
The magic happens when the MACD Line crosses over the Signal Line:
- MACD crosses above Signal Line = Potential buy signal.
- MACD crosses below Signal Line = Potential sell signal.
This crossover is like a traffic light telling you when to go or stop.
Why Traders Love MACD
Because it combines trend-following with momentum, giving a clearer picture than just looking at price movements alone. It helps spot trend changes early — kind of like having an early warning system.
Common MACD Trading Signals
- Zero Line Crossover: Shows momentum direction.
- Signal Line Crossover: Entry and exit points.
- Divergence: When price and MACD move differently, hinting at reversals.
MACD in Algorithmic Trading Strategies
Algorithmic trading uses automated rules to buy and sell assets. The MACD indicator often forms part of these strategies, especially for trend following and momentum-based algorithms. It’s like teaching a robot to watch the speedometer and act accordingly.
Benefits of Using MACD in Trading
- Simple to understand and use.
- Helps identify both trend direction and momentum.
- Useful across various timeframes and assets.
Limitations of MACD
No tool is perfect — MACD can give false signals, especially during sideways or choppy markets. It’s best used along with other indicators or analysis.
Tips for Using MACD Effectively
- Combine with volume or RSI for confirmation.
- Adjust time frames based on your trading style.
- Watch for divergence as a strong reversal hint.
Comparing MACD with Other Indicators
Unlike RSI which measures overbought or oversold levels, MACD focuses on momentum and trend changes. Some traders use both for a fuller picture.
Real-Life Example and Analogy
Imagine you’re driving a car (the price). The MACD is your speedometer and accelerator pedal combined—it tells you not only how fast you’re going but if you need to speed up or slow down soon. When the speed (MACD Line) crosses the pedal pressure (Signal Line), you decide to speed up (buy) or slow down (sell).
How to Combine MACD with Other Tools
For better trading results, MACD is often combined with:
- RSI (Relative Strength Index)
- Support and Resistance Levels
- Moving Averages
This way, traders get multiple confirmations before making moves.
Conclusion
The MACD indicator is a versatile and powerful tool that helps traders of all levels understand market momentum and spot potential trend reversals. By using the MACD crossover and combining it with other indicators, traders can make smarter, more confident trading decisions. While it’s not perfect and can give false signals in sideways markets, mastering its use within algorithmic trading strategies or manual trading can significantly improve your ability to navigate the markets. Think of MACD as your trading companion, giving you timely signals to speed up or slow down—and ultimately helping you stay on the right path.
Frequently Asked Questions (FAQs)
- What does MACD stand for?
MACD stands for Moving Average Convergence Divergence, a technical indicator used to measure momentum and trend direction in trading. - How does the MACD crossover work?
When the MACD Line crosses above the Signal Line, it indicates a potential buy signal. Conversely, crossing below the Signal Line signals a potential sell. - Can MACD be used in algorithmic trading?
Yes, MACD is commonly used in algorithmic trading strategies to help automate decisions based on momentum and trend signals. - Is MACD reliable in all market conditions?
MACD works best in trending markets but may provide false signals in sideways or choppy markets, so it’s good to combine it with other tools for confirmation. - What indicators work well with MACD?
MACD pairs well with indicators like RSI, support and resistance levels, and other moving averages to improve the accuracy of trading signals.